Opportunity Mining: Finding and Validating Technical Opportunities in Public Data Using Machine Learning and Large-Scale Data Aggregation
Xenova Systems. Working paper, September 2026.
Provenance note. Written by the author; edited with an AI agent working over the project’s own records, which sourced the citations and figures. Not every citation has been checked against the original source; the reference list is provided so that readers can. Corpus sizes and findings are the project’s own.
1. Context: why good work goes to waste
Most new products fail, and they fail for a reason that is knowable in advance. CB Insights, analysing startup post-mortems, has found “no market need” at the top of the list across a decade of data — 42% of failures in the original 110-company study, and 43% attributed to poor product-market fit in the 2024 update covering 431 venture-backed shutdowns (CB Insights 2024). Running out of cash is cited more often still, around 70%, but the same analysts flag it as a symptom rather than a cause: a product few people need doesn’t convert, doesn’t retain, and burns its runway trying to force a market that was never there (CB Insights 2024; preuve.ai 2026). The U.S. Bureau of Labor Statistics puts the plain survival number near 48% of new businesses failing within five years — lower than the folkloric 90%, but the leading identifiable cause is still building something nobody wanted badly enough to pay for.
The point that matters for this paper is not the rate but the timing: the information needed to avoid the failure almost always existed before the product was built. Target customers could have said the problem wasn’t painful, that the workaround was fine, or that they wouldn’t pay the price — but they were never asked, or were asked in a way that produced flattering answers.
A particular and expensive version of this hits anyone building something patentable: the freedom-to-operate problem. Whether an invention is already claimed by someone else’s patent is, like market need, knowable before the work — but a proper prior-art and freedom-to-operate search is slow, costs thousands of dollars in attorney time, and is error-prone, and getting it wrong sends people down months of development only to find the ground was owned the whole time. It is the same failure shape as no-market-need: confident effort against a fact that could have been checked first.
The same gap appears in a second place, between research and application. Innovations that clear peer review and prototype testing routinely die in what the commercialization literature calls the “valley of death”: past basic discovery, but too early for a commercial partner and too late for research funding, they sit at technology-readiness levels 4–6 with no one willing to carry them across (WAITRO 2026; Konfirmity 2026). In biotechnology one estimate puts the odds of an innovation reaching market at 1 in 5,000 to 10,000 (bioRxiv 2020). This is the gap the National Science Foundation built the Innovation Corps (I-Corps) to close. Launched in 2011 and based on Steve Blank’s Lean LaunchPad, I-Corps exists on the observation — Blank’s, from teaching it — that few business plans survive first contact with customers (Haas 2014). Its remedy is not more lab work but forced customer discovery: teams talk to potential customers, partners, and competitors, and the programme’s own principle is that commercialization requires finding a viable business model, not merely maturing the technology (White House OSTP 2014; Nishimura et al. 2022).
Two examples make the failure concrete. Juicero sold a $400 Wi-Fi-connected press for juice packs that buyers found they could squeeze by hand — a solution engineered well past any need that existed (Rydoo 2024). Pets.com spent its way through a Super Bowl ad and into bankruptcy inside two years on a model with no demand underneath it (Rydoo 2024). Neither failed on engineering. Both failed on the problem.
So the recurring failure is not incompetence. It is confident work aimed at a problem that was mis-specified, over-valued, or imaginary — and it is expensive precisely because it looks like progress the whole way down.
2. Where the problem actually lies
Knowing you should validate a problem does not make it easy. Validation is slow, it is skilled, and it is full of ideas that look good and aren’t.
It is slow and skilled because the honest version of it — customer discovery — means dozens of structured conversations and a disciplined reading of a technical field, both of which take weeks and neither of which most technical founders are trained to do. The ideas that look good and aren’t are the harder problem: a single enthusiastic customer, a solicitation that names a product, a crowded market that reads as “validated demand,” a quote pulled from one paper. Each of these is easy to find and each is misleading, and the person searching usually can’t tell the difference from inside the search. For most people a search engine is the only pass they can run at all — but a keyword search returns a thin surface scrape that depends on the exact terms entered and on how the index ranks pages for everyone, not on what actually matters to the question being asked. It is a good way to find what is popular and a poor way to find what is true.
Into that difficulty has arrived a tool that makes it worse while feeling like it makes it better: the large language model (LLM). People now ask an LLM whether their idea is good, and the model, tuned to be agreeable, tells them it is. South Park made the joke that landed — Randy Marsh running every scheme past ChatGPT, which affirms each one until his wife saves him by mimicking its voice and telling him to shut the farm down (South Park, “Sickofancy,” 2025). The joke works because the failure is real: the sycophancy of these models is a documented problem their own makers have acknowledged.
The deeper issue is structural, not a tuning bug. A language model is trained on human text, so its sense of what matters is the distribution of what people have written about. That distribution tracks attention — what is popular, funded, and fashionable — which is not the same as what is needed or valuable, and is often out of date by the time the model is trained. Ask such a model for opportunities and it returns the modal ideas plus a few noisy outliers, confidently, with no measurement of demand underneath any of them. It is a mirror of the conversation, and the conversation is exactly the biased signal that sends founders at popular, crowded, over-served problems in the first place.
So the gap persists, and the most convenient new instrument for closing it quietly widens it.
3. How the people who noticed this set out to close it
Several researchers and practitioners independently identified this gap and, working from different starting points, converged on strikingly similar answers. All of them say, in effect: stop guessing, go and measure, and here is how much measuring is enough.
Eric von Hippel (MIT) observed in 1986 that conventional market research cannot surface needs in fast-moving fields, because the users being surveyed have not yet felt the need. His answer was the lead user: find the users who face a need ahead of the market and have already built their own workaround, because they are the visible early signal of a demand that will become general (von Hippel 1986; Urban and von Hippel 1988; von Hippel 2005).
Abbie Griffin and John Hauser (1993) asked a question nobody had answered quantitatively: how many customers must you interview before you have heard most of what matters? Their experiment — 30 interviews, each read by multiple analysts — found that 20–30 one-on-one interviews surface 90–95% of the needs, and that using more than one analyst materially raises how many are caught (Griffin and Hauser 1993).
Anthony Ulwick (Strategyn) built Outcome-Driven Innovation around the observation that customers report solutions and specifications rather than the outcomes they actually judge a job by. His method fixes a countable target: a complete job map holds 50–150 desired outcomes, each scored on importance and satisfaction, and opportunity lives where importance is high and satisfaction is low (Ulwick 2005, 2016).
Greg Guest and colleagues (2006) showed that “enough” is measurable rather than a matter of taste: their interview codebook stabilised after twelve interviews, and later re-analyses put the number at 16–24 for full meaning and 20–40 across multiple sites (Guest et al. 2006; Hennink et al. 2017; Hagaman and Wutich 2017).
Steve Blank and the NSF turned all of this into a programme. I-Corps requires teams to conduct at least 100 customer-discovery interviews in seven weeks, and treats an evidence-backed go/no-go — not a business plan — as the deliverable (Nishimura et al. 2022). Rob Fitzpatrick’s The Mom Test (2013) supplies the discipline that keeps those interviews honest: ask about what people already do and what it costs them, never whether they would buy.
And Andrew Hargadon (2003), studying how breakthroughs actually happen, found that most are not invention from nothing but recombination — an existing mechanism carried from one industry into another by someone who happened to know both. TRIZ, the Soviet-era theory of inventive problem solving, reached a compatible conclusion by reading hundreds of thousands of patents: the same solutions recur across unrelated fields, and can be indexed by the function they perform.
Running underneath all of these is a second question every technical founder faces — not just is the problem real but is the solution already owned — and it is answered from the same public record of patents and their citations. The methods below treat both as measurement problems over the same corpora.
The convergence is the striking part. From market research, from qualitative method, from entrepreneurship education, and from the study of invention, the same two claims emerge: the signal you need is in what people already do, not what they say they want; and the amount of listening required to capture it is a specific, countable quantity.
4. Why this project
Every method above is sound and every one is done by hand — dozens of interviews, weeks of reading a field, expertise most technical people don’t have and most of the time can’t spare. The measuring that separates a real problem from an attractive one is exactly the labour that gets skipped, and skipping it is what the failure numbers at the start put a price on.
This project starts from a view I formed the long way. When I first learned engineering I spent most of my time thinking about all the things that could be built to make the world better, and I kept asking why they hadn’t been. After enough failed projects I understood that the hard part isn’t the building — it’s the gap between the people with the skill and the people with the need. Needs are abstract, and people who aren’t deep in the craft are usually wrong about what they actually need. Real engineering is rarely a better mousetrap; the best moves I’ve seen are simple, elegant, asymmetric approaches to a problem everyone already has. That last part isn’t original — it is Christensen’s disruption and von Hippel’s lead user restated from the bench — but it points at where the leverage is.
I hypothesise that a large part of the labour of finding those moves can be shifted off the person and onto public data. Patents, scientific literature, funding solicitations, and component catalogues already record, in enormous volume, what people do, what it costs them, what has been tried, and what it takes to build — and, crucially, so does a much wider field of public text: industry forums, community sites, trade press, and any source where the people with a problem describe it in their own words. The four corpora this project has assembled are a starting point, not the only or even the best source; some of the sharpest signal comes from wherever practitioners already talk. Modern computer-science and machine-learning techniques — vector representations of meaning, clustering, and LLMs used as careful readers rather than confident oracles — can turn that raw text into statistics: how many independent organisations describe a problem, how that has moved over time, how crowded the field is, what capabilities exist to attack it, and whether the approach is already patented. The output is not an answer but a measured brief, the thing a founder, an R&D lab, a technology-transfer office, or an individual engineer would otherwise spend weeks assembling by hand, and usually skips.
The demand question — will anyone pay for this — is one of a family of due-diligence questions, and most of that family is really information work over public record. Is this already patented; who else is working on it and did they give up; has this been tried before and failed on a limit that no longer holds; what is the best anyone has achieved on this measurement; what part already does this, at what price; where is funding asking for it. None of those are answered by inspiration and all of them are answered, slowly and expensively, by reading. That is what makes the instrument general-purpose rather than a business tool wearing a lab coat: whether the person is a founder, a researcher, an R&D lab, or an engineer, the bottleneck is the same synthesis over the same public record, and the discipline is the same — everything, science or business, eventually has to show that it is worth someone’s money or someone’s years, which is the value test the valley of death is really about.
Where the questions differ is in what closes them. The demand question ends in conversation. The customer-discovery interviews — the 20-to-30-plus structured conversations that Griffin and Hauser, Ulwick, and the NSF I-Corps programme all converge on — remain the thing that confirms a problem is real and worth paying to solve, and nothing computed from public text substitutes for a buyer saying so. What the analysis produces for that path is a set of qualified leads: the ideas worth interviewing about, and the specific people and organisations to interview, pulled straight from the records that raised the idea. The other questions — freedom to operate, prior art, landscape, revival, sourcing — are closed by the record itself plus a person’s judgement, with no one to interview. In both cases the analysis does the same two jobs: it decides which ideas earn the expensive next step, and it aims the ones that get it.
Both jobs matter because attention is the scarce resource. A person can properly investigate a handful of ideas, not a hundred, so the ideas that get investigated are usually the ones already in front of them — the biased, attention-driven selection that sinks so many products in the first place. A cheap, wide first pass over public data lets a whole frontier be screened before any single idea costs a week: it filters out the crowded, the already-owned, and the dead-on-arrival, and it surfaces doors a person did not know were open — an effect used everywhere in one industry and never tried in another, a lapsed patent sitting on top of a problem the market still describes as unsolved. Many technologies span domains, and the same core can be worth little in the field where it was born and a great deal one field over. Finding that out first is not a detail: picking the right domain and the right price point up front is often the difference between a solvable business and a good idea that runs out of runway proving itself in the wrong market. For the ideas that survive the pass, the same analysis front-loads the questions that decide whether an idea is a business at all — who else has the problem, what it costs them, how many alternatives already exist, and therefore what a solution could be priced at and what a buyer would plausibly pay — so that when the conversations do happen, they land. The order is: analyse widely to choose the idea, the domain, and the price, then spend the expensive step — a conversation or a person’s judgement — to confirm it.
What I am adding is not the insight but the instrument: a way to do the reading behind a technical bet at scale and with a number attached — to find the problems where a simple asymmetric approach would matter, the domain where a technology is worth most, and the ground that is already taken — before any of it costs a year.
5. What can be asked, and what answers it
The questions above look different on the surface — a founder sizing a market, a researcher hunting applications, an engineer sourcing a part, anyone checking whether the ground is already owned — but they draw on the same public record and the same handful of operations over it. The method rests on one observation: every corpus yields the same three kinds of record, and each question is answered by a different combination of them.
| Capability | Practice / need | Attention | |
|---|---|---|---|
| what it is | what can be done, by what mechanism, to what limit | what is done today, how often, with what, at what cost; what’s wanted | who says so, how many, in which fields, trending which way |
| Patents | claims | background section | assignees by type, per year, per class; legal status |
| Papers | results | abstract; “what stopped us” | institutions, persistence, abandonment |
| Funding & tenders | — | the ask and the current procedure | funders, sectors, dollars, per quarter |
| Datasheets | the part, with a price | — | makers |
| Effects library | the effect, by function | — | which fields use it, which don’t |
Every record carries the organisation behind it, so the list of people to talk to is produced along with the evidence. Five concrete questions, and the shape of what answers each:
A scientist has a result and needs to know where it applies. Embed the method’s description; find the nearest patent and paper topics; read the practices those topics describe and what they cost; surface the fields that have the practice but no capability record. Sources: needs and practices from patents and academic abstracts. Technique: vector database over backgrounds and abstracts, clustered, with nearest-neighbour search from the method’s own description.
An engineer or R&D lab has a client’s problem and needs a solution. State the problem as a function; retrieve candidate mechanisms from the effects library by function rather than name; retrieve matching parts, with prices, from the datasheet index. Sources: capabilities from the effects library and datasheets. Technique: function–behaviour–structure framing plus datasheet embedding, clustered, nearest-neighbour retrieval, read and assembled by a language model.
A founder has an idea and needs to know if the problem is real and priced right. Identify the practice the idea replaces; count how many organisations describe it, of what type, over what years; extract what it costs them from the text; measure how crowded the field is. Sources: practice and attention from patents and needs. Technique: practice-cost extraction, attention normalised against field baselines, opportunity scoring with confidence intervals.
An investor or reviewer needs to check a claimed need. Take the same practice and attention numbers as a test rather than a pitch: is the need described by anyone besides the applicant, is attention rising or dying, are prior attempts surviving or lapsing. Sources: attention from patents and papers. Technique: mention-frequency series with burst and change-point detection, survival analysis on patent legal status.
A corporate scout needs adjacencies and abandoned work. Take the firm’s own capabilities; find fields that never used them; find attempts that were tried and dropped and are now free to build on. Sources: capability and attention. Technique: effect-to-field gap detection, legal-status joins to find lapsed patents, breadth measured by spread across fields.
Anyone building something patentable needs to know if the ground is already owned. Start from the invention’s keywords and expand outward through patent classification and citation links, pruning noise with a model at each step, to assemble the set of prior art and live patents that bound what can be built. Sources: capability and attention from patents. Technique: iterative expansion over classification and citation graphs with language-model denoising, depth-tunable — the worked example later in this paper.
6. Structure: layers of abstraction over queryable corpora
The design principle is to keep a small number of cheaply queryable corpora at the bottom and compute higher-order statistics in layers above them, rather than building a bespoke pipeline per question. The corpora are turned into maps of meaning — each document a vector, similar documents near each other — and partitioned into topics by clustering, so that a topic can be sampled, counted, tracked over time, and joined to another corpus by distance rather than keyword. On top of that base sit the three extractions above, and on top of those sit the statistics that actually indicate opportunity: how the mention of a problem changes over time, who is describing it, how concentrated the field is, whether solution attempts survive.
The valuable questions are mostly cross-corpus and cross-time, and each is a specific join:
- new applications for an emerging capability — a datasheet capability, or a newly reported effect, matched against practices in fields that have never used it;
- revived dead ends — old scientific results that failed on a limit (cost, resolution, size) that a current sensor or a current price no longer imposes;
- expiring monopolies against live demand — patents lapsing or expiring, matched against practices the market still describes as costly, so a protected approach becomes free exactly where a need persists. The clearest example is desktop 3D printing: Stratasys held the foundational fused-deposition-modelling patents through the 2000s, and when the key FDM patent expired the RepRap project and then MakerBot built open, low-cost printers on the freed method — the entire consumer FDM industry that followed is the result of a live, unmet demand meeting a monopoly that had just lapsed.
The last piece is ground truth. Statistics derived this way are proxies, and proxies must be checked against something outside the data or they become confident noise. What the check is depends on the question. For a demand question it is the customer-discovery conversation done deliberately — the brief carries the conditions that would kill the idea and the corpus check that would reveal each, plus a stated probability of surviving to a confirmed problem, and once leads have run through interviews and a bench test that probability is graded against what happened. For a record-settled question — freedom to operate, prior art, landscape — the check is a bounded region read exhaustively and a person’s judgement against it, and the honest measure is coverage rather than a verdict. Either way the discipline is the same: every computed signal is eventually scored against an outcome, so the system learns which signals predicted something real and which were decoration. That grading loop — not any single score — is what separates this from asking a confident model and believing it.
7. What has been built, and what it takes
These corpora are the foundation the whole system is built on. What sits on top of them — the tools that rank, score, and qualify at scale — is proprietary and not shared here; what follows is the base layer and two real examples of the approach working against it. More will be added to this section as additional tools are built, tested, and analyzed.
7.1 The corpora
| Corpus | What is in it | State |
|---|---|---|
| Needs | ~675,000 records from 110 sources — solicitations, tenders, grant programmes, and investors saying what they want built | Complete, still growing |
| Papers | ~828,000 scientific abstracts, filtered from an open bibliographic snapshot | Complete; every cluster read once |
| Patents | ~7.2M granted US patents and ~3.6M applications, with ~151M citations, classification codes, and legal status | Complete for US filings from 2002 on |
| Parts | ~97,000 electronic parts across ~302,000 datasheet pages | Partial |
All of it runs on a single consumer graphics card. No commercial API sits in the reading path, and none of this is licensed data — it is public record, assembled. Every record is turned into a vector standing for its meaning, so a problem can be found by describing it rather than by guessing the words someone else used, and every search is logged before its results are used, so repeated searches accumulate coverage rather than re-tread the same ground.
The patent, paper, and parts corpora are scoped: US patents from 2002 forward, no foreign filings and no unpublished provisional applications; the papers and parts cover the capability areas the project works in rather than every field. Answers built on them carry that scope, and silence inside a scoped corpus is never treated as evidence that something does not exist.
7.2 Getting signal out of the data is the hard part
The largest single lesson so far is that the raw data is far messier than its scale suggests, and most of the work is in careful data handling rather than in the reading. Public bibliographic and patent records arrive with missing fields, records whose text belongs to a different document, formatting that defeats machine reading until it is repaired, and outright junk that has to be detected and removed. Left alone, all of it lowers the signal-to-noise ratio of anything computed downstream — a ranking is only as trustworthy as the cleanliness of what fed it. So a large fraction of the effort is unglamorous: measuring each defect, writing a detection rule for it, recording that rule’s error rate, and checking every quotation a model produces back against the document it came from so that nothing fabricated survives into a result. This is the part that does not show up in a demo and is the part that makes the numbers mean anything.
The same difficulty is where the interesting levers are. When a stated problem is vague — “a cheaper part,” “a lower-noise readout” — it cannot yet be matched against a real component, and getting from vague to actionable is an open line of work with several approaches still to try. The measurement that is solid today is that precise, matchable problem statements are the minority, which is exactly why extracting and sharpening them is worth the effort.
7.3 A worked example: a wildlife-monitoring project
The first project this pipeline pointed at started from a decision to work on wildlife monitoring and a scrape that went past the four core corpora. Alongside the papers, I pulled from WildLabs — the conservation-technology community where field researchers describe, in plain language, what they are trying to do and what is going wrong — and cross-read it against the tracking-tag literature.
The signal was immediate and unambiguous, and it was stated directly rather than inferred. Paper after paper spelled out the same need in detail: tracking tags are too expensive and, above all, not reliable enough. One figure recurred and held up: two separate papers put first-deployment failure at roughly half of tags deployed, agreeing to within two percentage points; lack of reusability came up again and again as a second theme. And then the tell that matters most in the lead-user sense — the one von Hippel pointed at — turned up all over the record: biologists with no electronics background trying to build their own tags out of Arduinos and other hobby parts, producing fragile, hacky bridges because nothing on the market filled the gap. When the people with the problem are visibly building their own bad version of the solution, the need is real and unmet, and the market is telling you so for free. That combination — a need stated explicitly, a cost and a failure rate attached, and lead users hacking their own fixes — was enough on its own to launch a project.
Two things about this example generalise. First, the strongest signal did not come from the tidy structured corpora but from where practitioners actually talk; the scrape of a community site did more than any single index. Second, this was a demand finding, and it is exactly the kind that still ends in conversation — the record said the need was real, and the interviews are what confirm who needs it and at what price point it becomes usable to them.
7.4 A worked example: freedom-to-operate search
Where the wildlife example is a demand finding that ends in conversation, this one is the other kind — a question the record settles on its own. Establishing whether an invention is already claimed — prior-art and freedom-to-operate search — is normally slow, expensive, and error-prone, and getting it wrong is among the costliest pre-build mistakes a technical founder can make.
The scale of that cost, and of the problem, is worth stating. A professional freedom-to-operate search and opinion commonly runs $10,000 and beyond, with a patentability search alone in the low thousands (InQuartik 2021; ipCapital 2026; PerspireIP 2026). And the public examination that stands behind every granted patent is thinner than most people assume: US examiners spend, on average, roughly 19 hours total on an entire application — reading it, searching prior art, writing rejections, and arguing through several rounds — and under that time pressure they are measurably more likely to allow an invalid patent than to reject a valid one, a gap that shows up against both later US challenges and parallel foreign examinations (Frakes and Wasserman, via Jotwell 2019). Relevant prior art is missed not because it is ranked low but because it used different words, sat in an unexpected place, or was simply never reached in the time available. The task is expensive, and even done officially it is imperfect.
The method here is iterative: start from the invention’s keywords, widen the candidate set through the patent classification system and through the citations made by applicants and examiners, let a model prune the noise, then re-seed from what survives and repeat. Depth is a dial — more passes recover more prior art at the cost of more time.
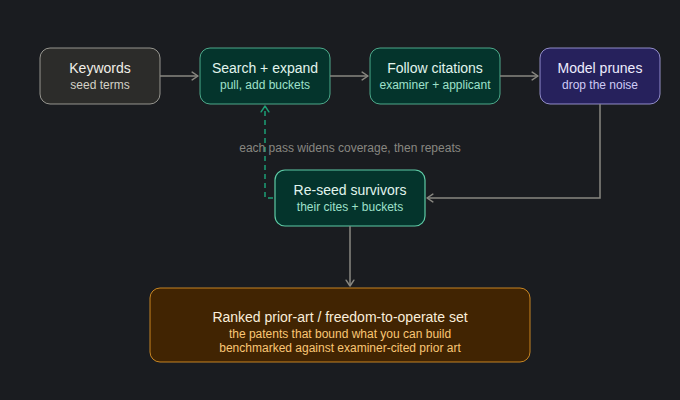
The finding that matters is about where recall comes from. Patents are written to be hard to find — a document says CCD and never says camera — and reading deeper into a plain search barely helps: widening a meaning-and-keyword search forty-fold moves recall only from roughly a tenth to roughly four in ten of the prior art an examiner actually cited. The documents that are missed are never retrieved at all, because they never used the words. What lifts recall past that ceiling is following citations and classification codes — links compiled by people who read the claims, and codes assigned regardless of the words the applicant chose. Benchmarked against the prior art examiners cited, with the test patent removed from the index and the examiners blind to the tool, the search reaches 75-90% across several named technologies, against roughly 90% for a professional landscape search — at a cost of hours of local compute rather than tens of thousands of dollars. An earlier figure near 90% came from the system grading its own output; benchmarking against examiners instead moved it down, which is the honest direction for a number to move.
What the system does not do is render a verdict. Nothing it produces says infringes, freedom to operate, clear, or safe. It returns assignee counts and the closest titles; the judgement is a person’s, made with the coverage number and the corpus scope stated alongside it. It shows what these corpora are for: the same public record, read at machine scale, doing in hours and for the cost of local compute a piece of work that is otherwise slow, costly, and imperfect even when done by hand.
More is under development. Most of what this base layer could support will take time and testing to realize, and more will be posted here as it does.
References
CB Insights (2024). The Top 12 Reasons Startups Fail. cbinsights.com/research/report/startup-failure-reasons-top.
Griffin, A., and Hauser, J. R. (1993). The voice of the customer. Marketing Science 12(1), 1–27.
Guest, G., Bunce, A., and Johnson, L. (2006). How many interviews are enough? An experiment with data saturation and variability. Field Methods 18(1), 59–82.
Hagaman, A. K., and Wutich, A. (2017). How many interviews are enough to identify metathemes in multisited and cross-cultural research? Field Methods 29(1), 23–41.
Hargadon, A. (2003). How Breakthroughs Happen. Harvard Business School Press.
Hennink, M. M., Kaiser, B. N., and Marconi, V. C. (2017). Code saturation versus meaning saturation. Qualitative Health Research 27(4), 591–608.
Nishimura, J., et al. (2022). The impact of the National Science Foundation’s Innovation Corps (I-Corps) on academic innovation and entrepreneurship. (PMC9717574.)
Ulwick, A. W. (2005). What Customers Want. McGraw-Hill. — (2016). Jobs to Be Done: Theory to Practice. Idea Bite Press.
Urban, G. L., and von Hippel, E. (1988). Lead user analyses for the development of new industrial products. Management Science 34(5), 569–582.
von Hippel, E. (1986). Lead users: A source of novel product concepts. Management Science 32(7), 791–805. — (2005). Democratizing Innovation. MIT Press.
Christensen, C. M., and Raynor, M. E. (2003). The Innovator’s Solution. Harvard Business School Press.
Fitzpatrick, R. (2013). The Mom Test.
Blank, S. (2005). The Four Steps to the Epiphany.
South Park (2025). “Sickofancy,” season 27, episode 3. Comedy Central.
Data and statistics. CB Insights startup post-mortems (2024); preuve.ai analysis of the CB Insights 2024 update (2026); Rydoo, “Why Startups Fail” (2024); U.S. Bureau of Labor Statistics business-survival data; WAITRO and Konfirmity on the commercialization “valley of death” (2026); bioRxiv 10.1101/2020.05.04.075770 (2020); White House OSTP, “Lab Bench to Bedside” (2014); Haas Newsroom on Lean LaunchPad and I-Corps (2014); Patently-O on the USPTO backlog (2024); MadePatents on maintenance-fee abandonment (2026); Statista/WIPO, patents in force as a percentage of applications (2024); InQuartik, ipCapital Group, and PerspireIP on freedom-to-operate search and opinion costs (2021, 2026); Frakes and Wasserman on examiner time and error, via Jotwell (2019). Full URLs on file.
Method references (Good–Turing, Chao1, Kleinberg, Killick et al., Kaplan–Meier, Efron and Tibshirani, Brier, Thurstone, Bradley–Terry, and the TRIZ effects database) apply to the analysis layer and are listed in the companion methods note.